Make and visualise DNA Models
It is recommended that you run this example inside a Jupyter environment rather than a VSCode or similar environment
This requires the mayavi jupyter extension jupyter nbextension install --py mayavi --user
[ ]:
import sys
from pathlib import Path

try:
    from fractaldna.dna_models import dnachain as dna
except (ImportError, ModuleNotFoundError):
    # Path modifications for when running out of git repo
    sys.path.append(str(Path.cwd().parent.parent.parent))
    from fractaldna.dna_models import dnachain as dna

from mayavi import mlab

# Disable this option for interactive rendering
mlab.options.offscreen = True

# Enable this option for an interactive notebook
# mlab.init_notebook()
Making Multi-Strand DNA
The module currently supports 2-, 4- and 8- strand multi-chains in different configurations
[ ]:
# Make a 40 base pair long DNA Strand
chain = dna.FourStrandDNAChain("GTAC" * 50, 50)
# Generate a simple Matplotlib visualisation
# The basic plot shows each molecule as a point
plot = chain.to_plot()
plot.gca().set_title("Basic Plot")
Generating nicer plots with MayaVI
[ ]:
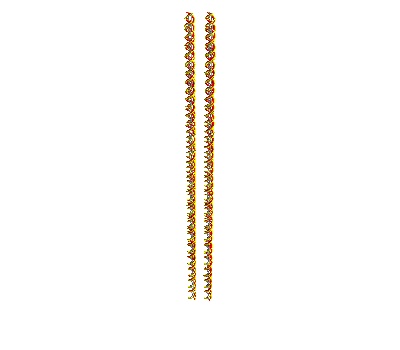
# MayaVI can generate nicer plots, joining the strands together
plot = chain.to_strand_plot()
plot.scene.save_jpg("multi_strand_strand_plot.jpg")
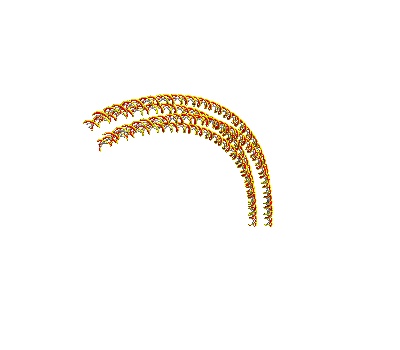
Generating curved strands
[ ]:
# These can also be curved
chain = dna.FourStrandTurnedDNAChain("GTAC" * 50, 50)
plot = chain.to_strand_plot()
plot.scene.save_jpg("multi_strand_turned_strand_plot.jpg")
Exporting to dataframe or text
The export dataframe has the following columns
name: molecule name
shape: molecule shape (sphere or ellipse)
chain_idx: The index of the DNA chain of the molecule (chains are double helices)
strand_idx: An index to indicate which side of the double helix a molecule is on.
bp_idx: The index of the base pair
size_x: semi-major x axis in Angstom
size_y: semi-major y axis in Angstom
size_z: semi-major z axis in Angstom
pos_x: x-position in Angstrom
pos_y: y-position in Angstrom
pos_z: z-position in Angstrom
rot_x: Euler rotation of molecule about the x-axis (radians)
rot_y: Euler rotation of molecule about the y-axis (radians)
rot_z: Euler rotation of molecule about the z-axis (radians)
[ ]:
# And then loaded into a data frame
chain.to_frame()
[ ]: