How to make a Voxelised DNA Structure
DNA Structures are built from L-string seeded fractals.
L-strings and L-systems provide a grammar that can be used to generate a fractal. In this work, Hilbert curves are generated that are then converted into cubic placement ‘voxels’ for use in modelling.
[1]:
import sys
from pathlib import Path

try:
    # The voxelisation library produces the cubic voxelisation that
    # can be used to build DNA
    from fractaldna.structure_models import voxelisation as v

    # The hilbert module produces and handles L-Strings
    from fractaldna.structure_models import hilbert as h
except (ImportError, ModuleNotFoundError):
    sys.path.append(str(Path.cwd().parent.parent.parent))
    from fractaldna.structure_models import voxelisation as v
    from fractaldna.structure_models import hilbert as h

import numpy as np
import matplotlib.pyplot as plt
from mpl_toolkits.mplot3d import Axes3D
Producing L-Strings
The hilbert model encodes a few basic fractals which can create Hilbert curves. These are
h.X: n<XFn<XFX-Fn>>XFX&F+>>XFX-F>X->
h.A: B-F+CFC+F-D&FnD-F+&&CFC+F+B<<
h.B: A&FnCFBnFnDnn-F-Dn|FnB|FCnFnA<<
h.C: |Dn|FnB-F+CnFnA&&FA&FnC+F+BnFnD<<
h.D: |CFB-F+B|FA&FnA&&FB-F+B|FC<<
Reference to these are all stored in hilbert.SUBSTITIONS.
The L-String language works as follows:
interpret
Fas DrawForward(1);interpret
+as Yaw(90);interpret
-as Yaw(-90);interpret
nas Pitch(90);interpret
&as Pitch(-90);interpret
>as Roll(90);interpret
<as Roll(-90);interpret
|as Yaw(180);
To ‘iterate’ an L-String, replace any reference to a subsititution with its value.
[2]:
print("h.X:", h.X)
print("h.A:", h.A)
print("h.B:", h.B)
print("h.C:", h.C)
print("h.D:", h.D)

print("\nh.X iterated once:", h.iterate_lstring(h.X))
h.X: n<XFn<XFX-Fn>>XFX&F+>>XFX-F>X->
h.A: B-F+CFC+F-D&FnD-F+&&CFC+F+B<<
h.B: A&FnCFBnFnDnn-F-Dn|FnB|FCnFnA<<
h.C: |Dn|FnB-F+CnFnA&&FA&FnC+F+BnFnD<<
h.D: |CFB-F+B|FA&FnA&&FB-F+B|FC<<

h.X iterated once: n<n<XFn<XFX-Fn>>XFX&F+>>XFX-F>X->Fn<n<XFn<XFX-Fn>>XFX&F+>>XFX-F>X->Fn<XFn<XFX-Fn>>XFX&F+>>XFX-F>X->-Fn>>n<XFn<XFX-Fn>>XFX&F+>>XFX-F>X->Fn<XFn<XFX-Fn>>XFX&F+>>XFX-F>X->&F+>>n<XFn<XFX-Fn>>XFX&F+>>XFX-F>X->Fn<XFn<XFX-Fn>>XFX&F+>>XFX-F>X->-F>n<XFn<XFX-Fn>>XFX&F+>>XFX-F>X->->
Drawing Fractals
The function generate_path will generate a list of XYZ-points for a fractal L-String as below, which can then be plotted in matplotlib
[3]:
print("Points seperated by 1 unit, no intermediate points")
print(h.generate_path("F", distance=1, n=1))
print("-")
print("Points seperated by 1 unit, 2 intermediate points")
print(h.generate_path("F", distance=1, n=2))
Points seperated by 1 unit, no intermediate points
[array([0, 0, 0]), array([1., 0., 0.])]
-
Points seperated by 1 unit, 2 intermediate points
[array([0, 0, 0]), array([0., 0., 0.]), array([1., 0., 0.])]
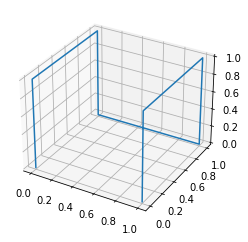
[4]:
x_curve = np.array(h.generate_path(h.X, distance=1, n=10))

fig = plt.figure()
ax = fig.add_subplot(111, projection="3d")

ax.plot(x_curve[:, 0], x_curve[:, 1], x_curve[:, 2])
[4]:
[<mpl_toolkits.mplot3d.art3d.Line3D at 0x7fe943037c50>]
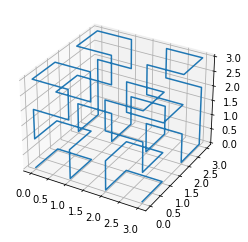
[5]:
x_iterated = h.iterate_lstring(h.X)
x_curve2 = np.array(h.generate_path(x_iterated, distance=1, n=10))

fig = plt.figure()
ax = fig.add_subplot(111, projection="3d")

ax.plot(x_curve2[:, 0], x_curve2[:, 1], x_curve2[:, 2])
[5]:
[<mpl_toolkits.mplot3d.art3d.Line3D at 0x7fe9438b3c10>]
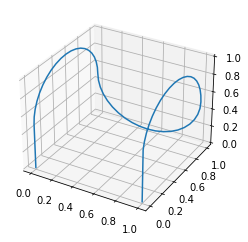
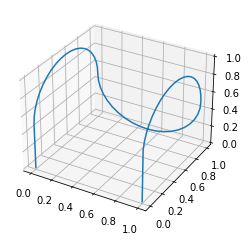
Making voxelised representations.
The voxelisation model can convert the path of this curve to a voxelised representation, of straight and curved boxes.
[6]:
voxelised_fractal = v.VoxelisedFractal.fromLString(h.X)

# This can be plotted
voxelised_fractal.to_pretty_plot()
[6]:
Exporting large-scale structures to text.
[7]:
# And this can be returned as a data frame, or as text
voxelised_fractal.to_frame()
[7]:
| IDX | KIND | POS_X | POS_Y | POS_Z | EUL_PSI | EUL_THETA | EUL_PHI | |
|---|---|---|---|---|---|---|---|---|
| 0 | 0 | straight | 0.0 | 0.0 | 0.0 | 0.000000 | -0.000000 | 0.000000 |
| 1 | 1 | turn | 0.0 | 0.0 | 1.0 | 0.000000 | -0.000000 | 1.570796 |
| 2 | 2 | turn | -0.0 | 1.0 | 1.0 | -1.570796 | 1.570796 | 0.000000 |
| 3 | 3 | turntwist | -0.0 | 1.0 | 0.0 | 3.141593 | -0.000000 | 0.000000 |
| 4 | 4 | turn | 1.0 | 1.0 | -0.0 | -3.141593 | -1.570796 | 0.000000 |
| 5 | 5 | turntwist | 1.0 | 1.0 | 1.0 | 0.000000 | -0.000000 | -1.570796 |
| 6 | 6 | turn | 1.0 | 0.0 | 1.0 | 1.570796 | 1.570796 | 0.000000 |
| 7 | 7 | straight | 1.0 | -0.0 | 0.0 | 3.141593 | -0.000000 | 0.000000 |
[ ]: